Page 145 - Diagnóstico ambiental estratégico para un desarrollo sostenible
P. 145

Resultados del diagnóstico de terreno


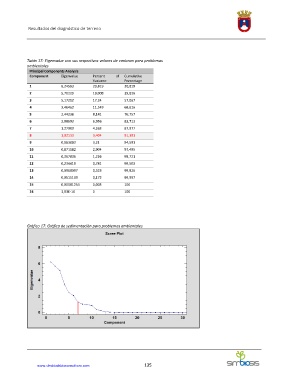
            Tabla 17: Eigenvalue con sus respectivos valores de varianza para problemas
            ambientales
             Principal Components Analysis
             Component     Eigenvalue   Percent   of   Cumulative
                                        Variance     Percentage
             1             6,24563      20,819       20,819
             2             5,70229      19,008       39,826
             3             5,17212      17,24        57,067
             4             3,46462      11,549       68,616
             5             2,44238      8,141        76,757
             6             2,08693      6,956        83,713
             7             1,27903      4,263        87,977
             8             1,02133      3,404        91,381
             9             0,963083     3,21         94,591
             10            0,871182     2,904        97,495
             11            0,367836     1,226        98,721
             12            0,234419     0,781        99,503
             13            0,0968097    0,323        99,826
             14            0,0515139    0,172        99,997
             15            0,00081254   0,003        100
             16            3,93E-16     0            100


            Gráfico 17: Gráfica de sedimentación para problemas ambientales


                 www.simbiosisbioconsultora.com              135
   140   141   142   143   144   145   146   147   148   149   150