Page 154 - Diagnóstico ambiental estratégico para un desarrollo sostenible
P. 154

DIAGNÓSTICO AMBIENTAL ESTRATÉGICO


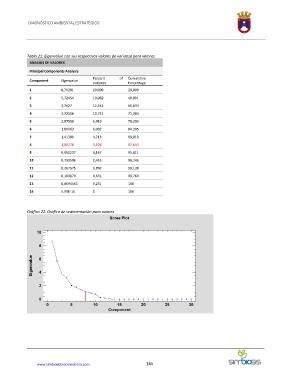
            Tabla 21: Eigenvalue con sus respectivos valores de varianza para valores
             ANALISIS DE VALORES
             Principal Components Analysis
                                        Percent    of   Cumulative
             Component     Eigenvalue
                                        Variance       Percentage
             1             8,70281      29,009         29,009
             2             5,72454      19,082         48,091
             3             3,7627       12,542         60,633
             4             3,22516      10,751         71,384
             5             2,07558      6,919          78,303
             6             1,80063      6,002          84,305
             7             1,41389      4,713          89,018
             8             1,08776      3,626          92,644
             9             0,950227     3,167          95,811
             10            0,730506     2,435          98,246
             11            0,267575     0,892          99,138
             12            0,189179     0,631          99,769
             13            0,0694463    0,231          100

             14            5,99E-16     0              100


            Gráfico 22: Gráfica de sedimentación para valores


                 www.simbiosisbioconsultora.com               144
   149   150   151   152   153   154   155   156   157   158   159